Trophic Levels Part 1: Why they Matter
The concept of a trophic level is intended to simplify and explain the dynamic interactions between organisms throughout a food chain. Understanding these interactions can lead to useful applications for sustainability, ecosystem function, and human health.
This two-part series will explore aquatic trophic levels and how they can help inform our seafood sourcing decisionns.
What is a Trophic Level?
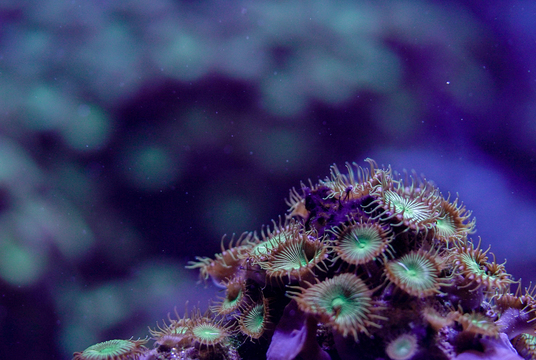
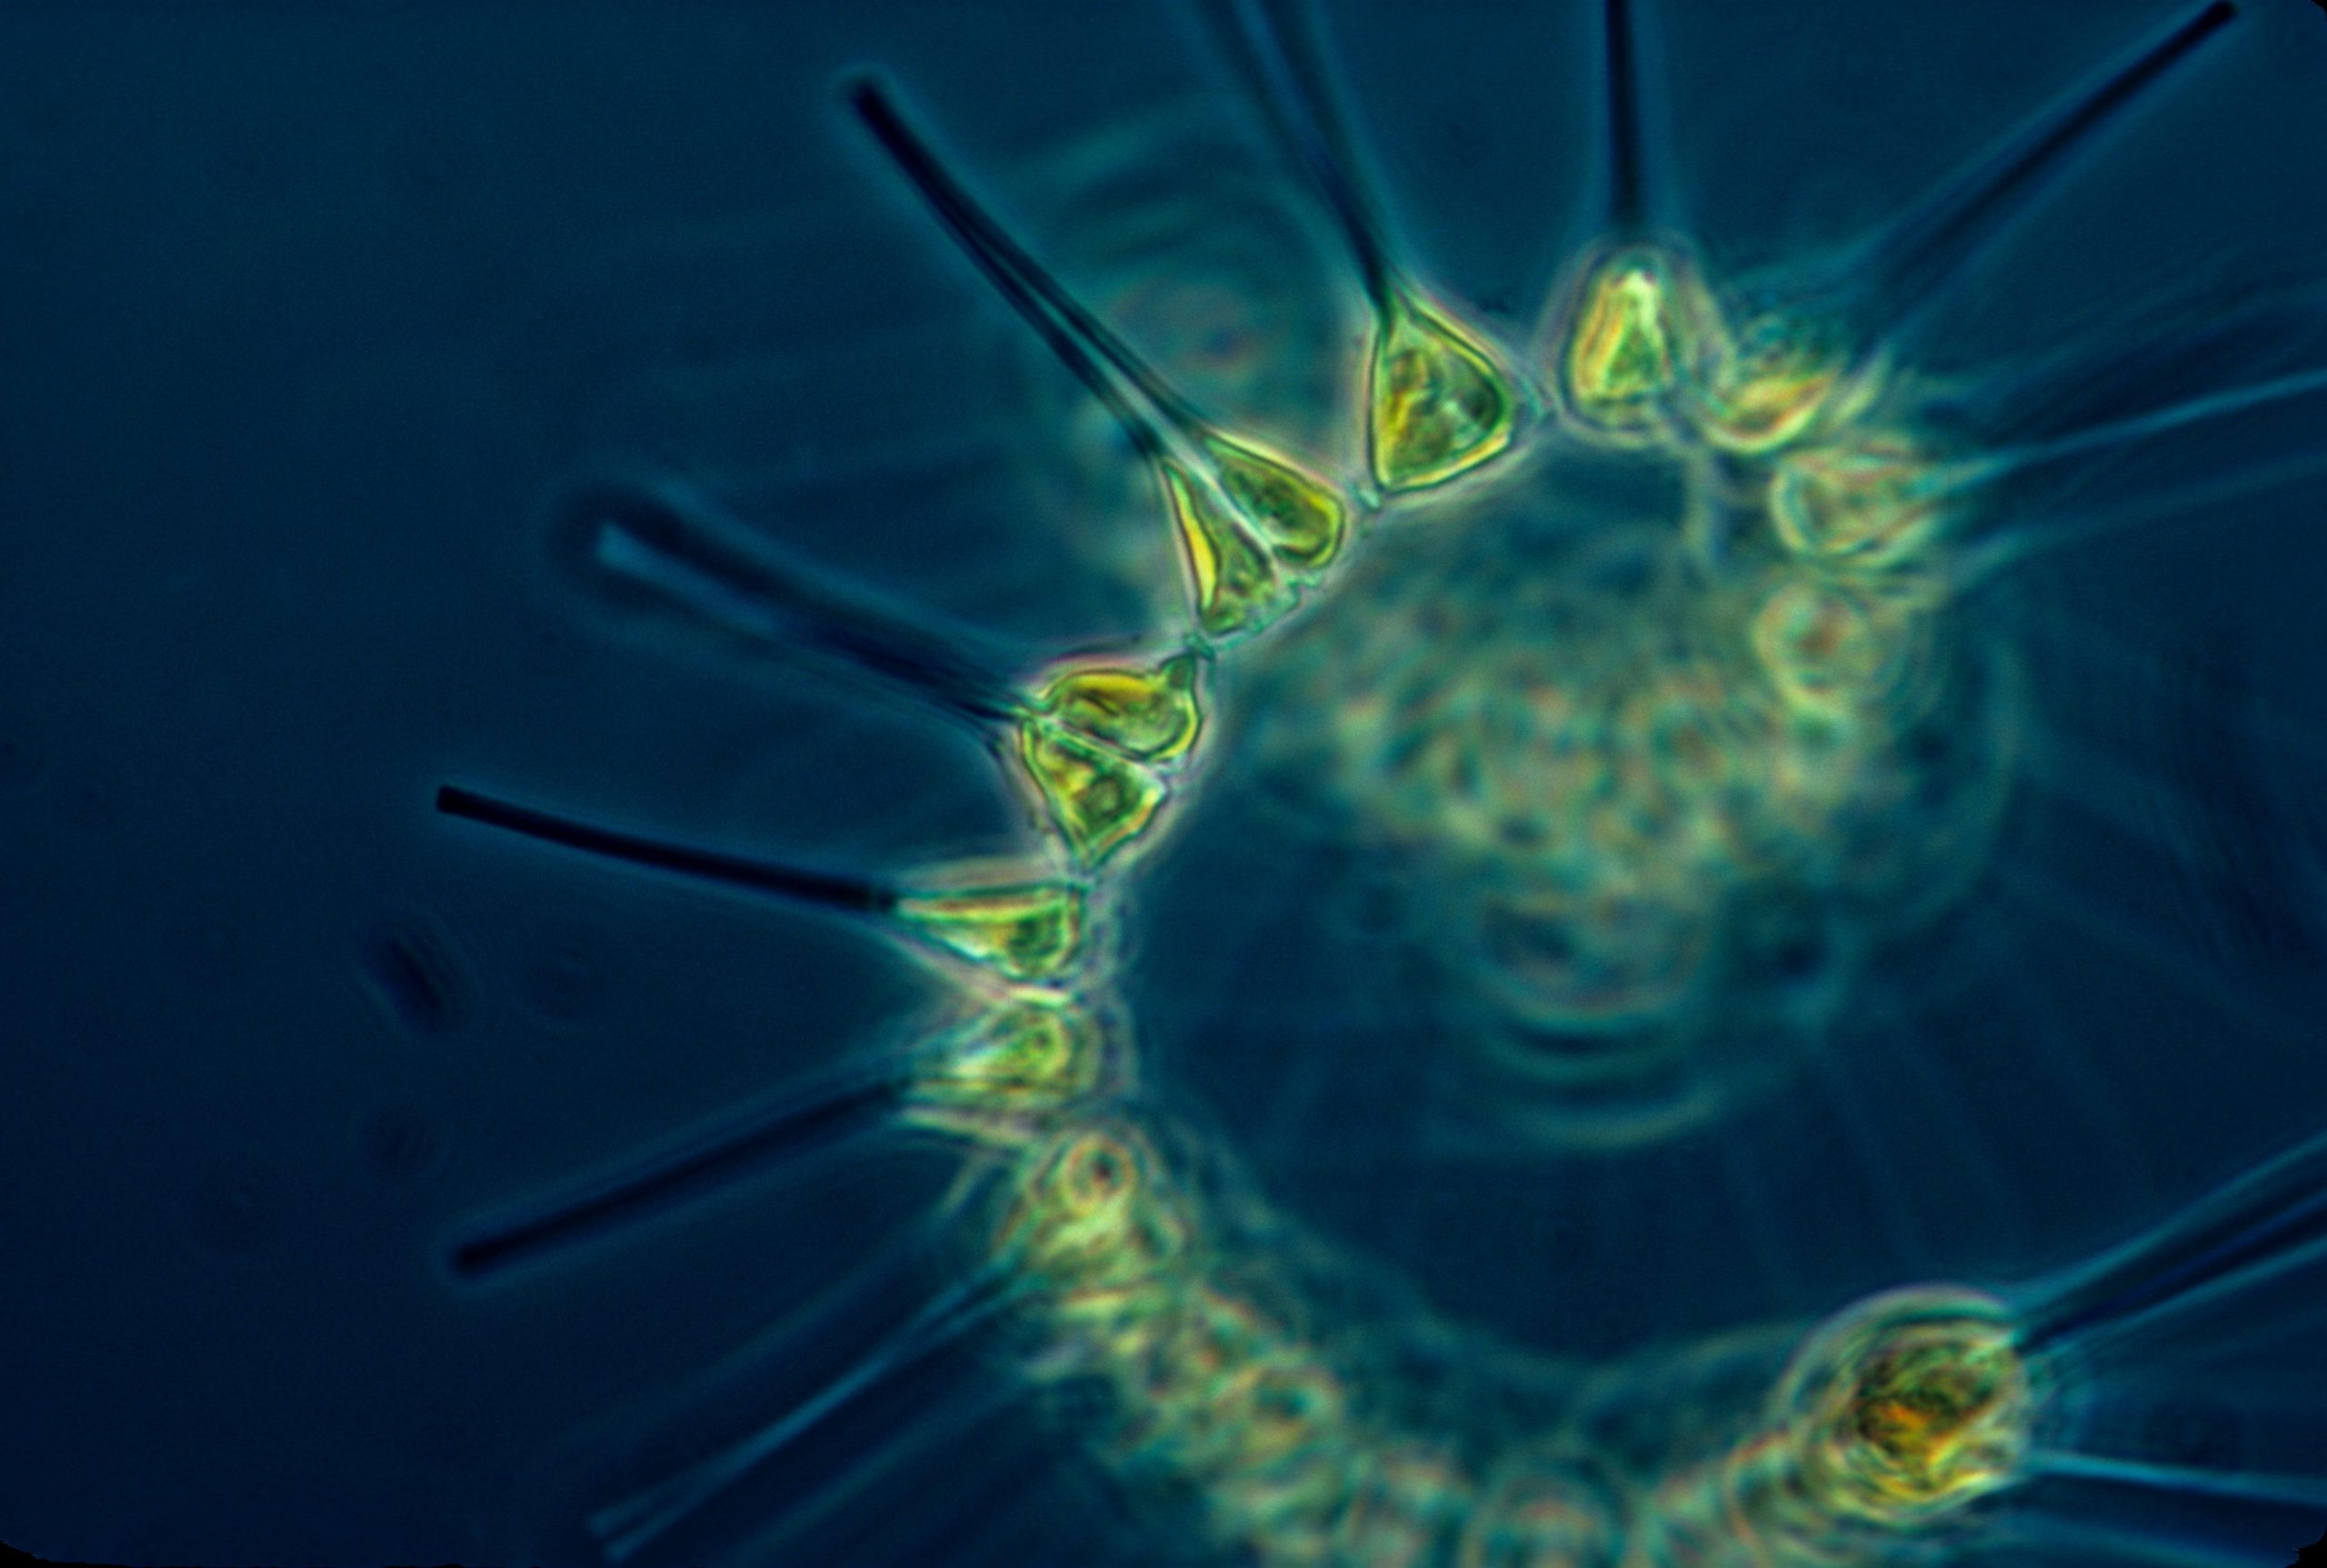
Trophic levels refer to a level or position in a food chain or food web. It is one of the oldest concepts in ecology that seeks to explain the energy relations between different organisms. As seen in the figure below, the bottom trophic level is known as the primary producers. These are usually plants like phytoplankton, algae, and seaweed. They can make their own food (usually photosynthesizing sugars from the sun), and do not need to consume other plants or animals. They are typically the most abundant organisms found in the ecosystem.
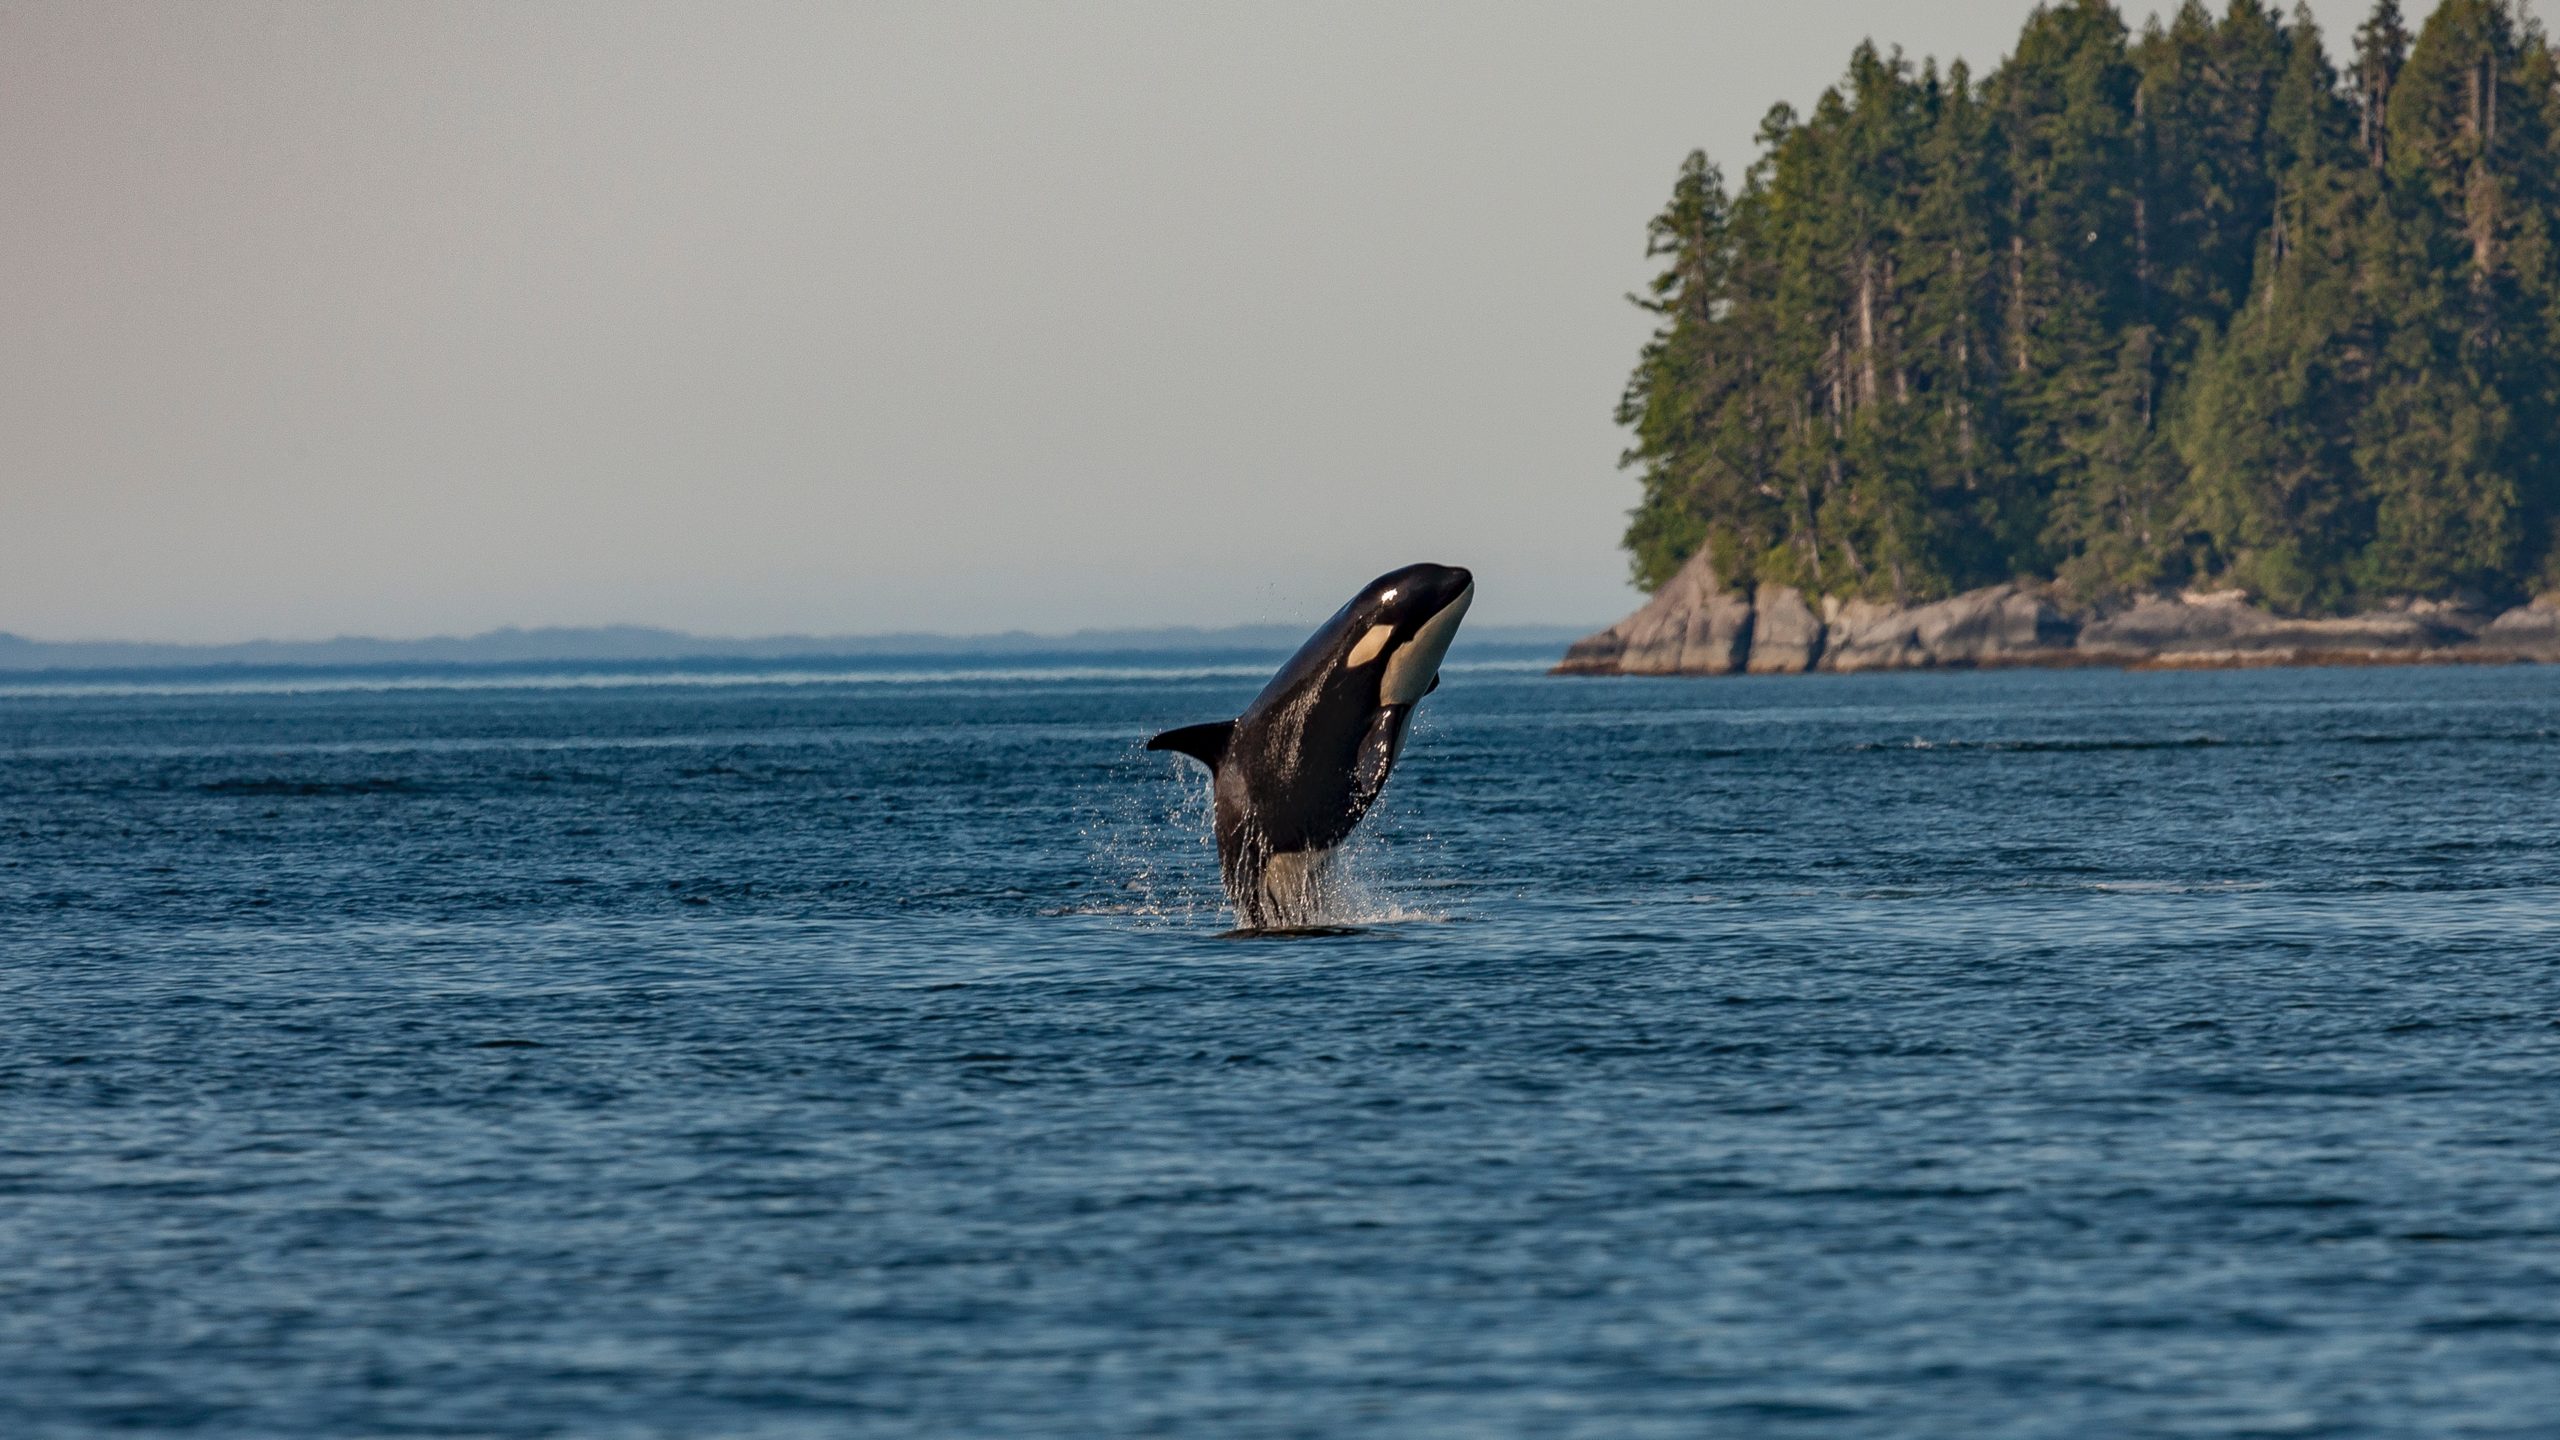
Above that are the herbivorous consumers, or animals that feed on plants. Some examples of these include zooplanktons, cockles, and bivalves. Following this we have carnivorous consumers: animals that are considered “meat eaters” because their energy comes directly from other animal products. The carnivores are broken into tiers; the first level carnivores consist of crustaceans, small fish, jellyfish, and others that generally consume small herbivores. For the second level, third level, and top carnivores, each level consumes more energy than the last. These levels consist of animals from larger fish such as pike or bass, to squids, sharks, Orcas and many more.
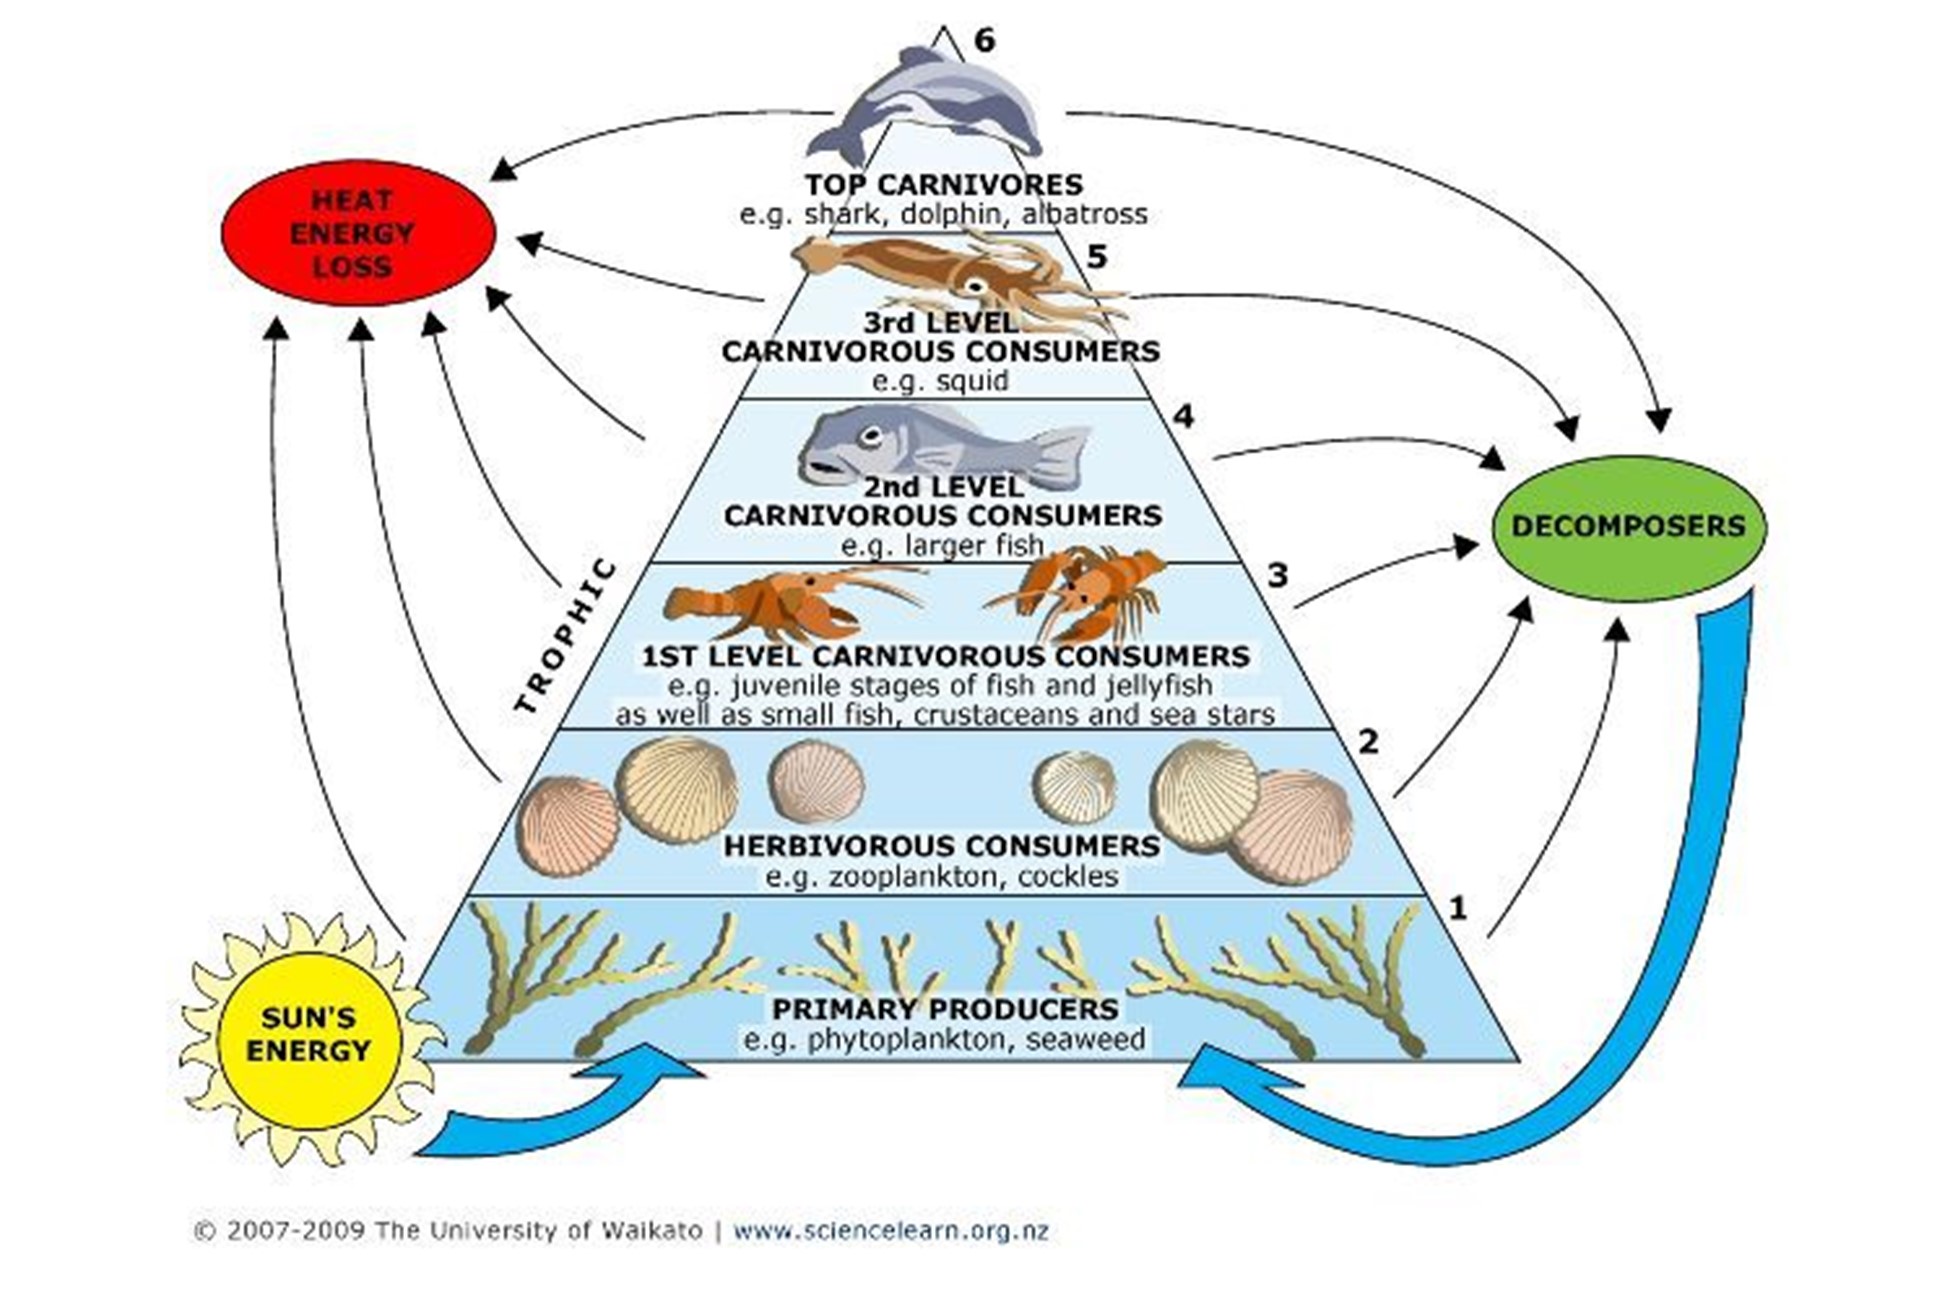
Different amounts of energy are transferred as we move up the trophic chain. Producers support the levels above them because they get their energy from the sun. When herbivores consume the producers, approximately 10% that energy gets transferred to the herbivores. This is why they need to eat so many plants!
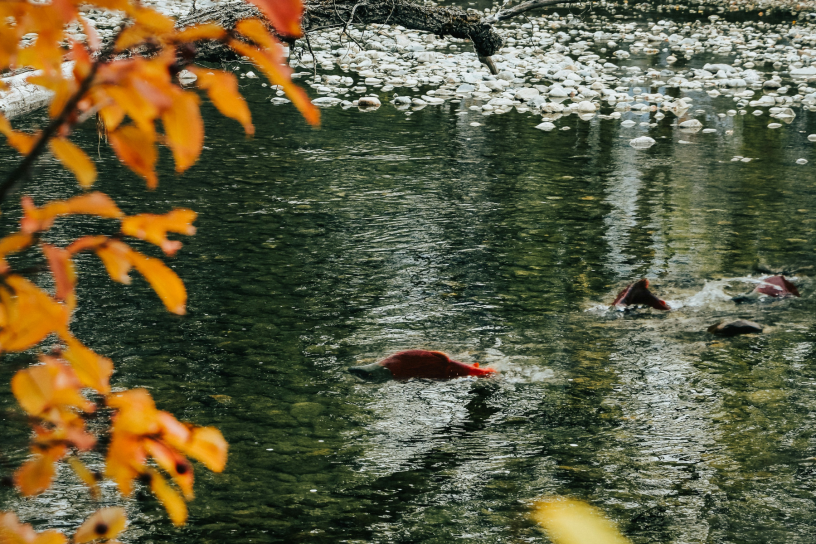
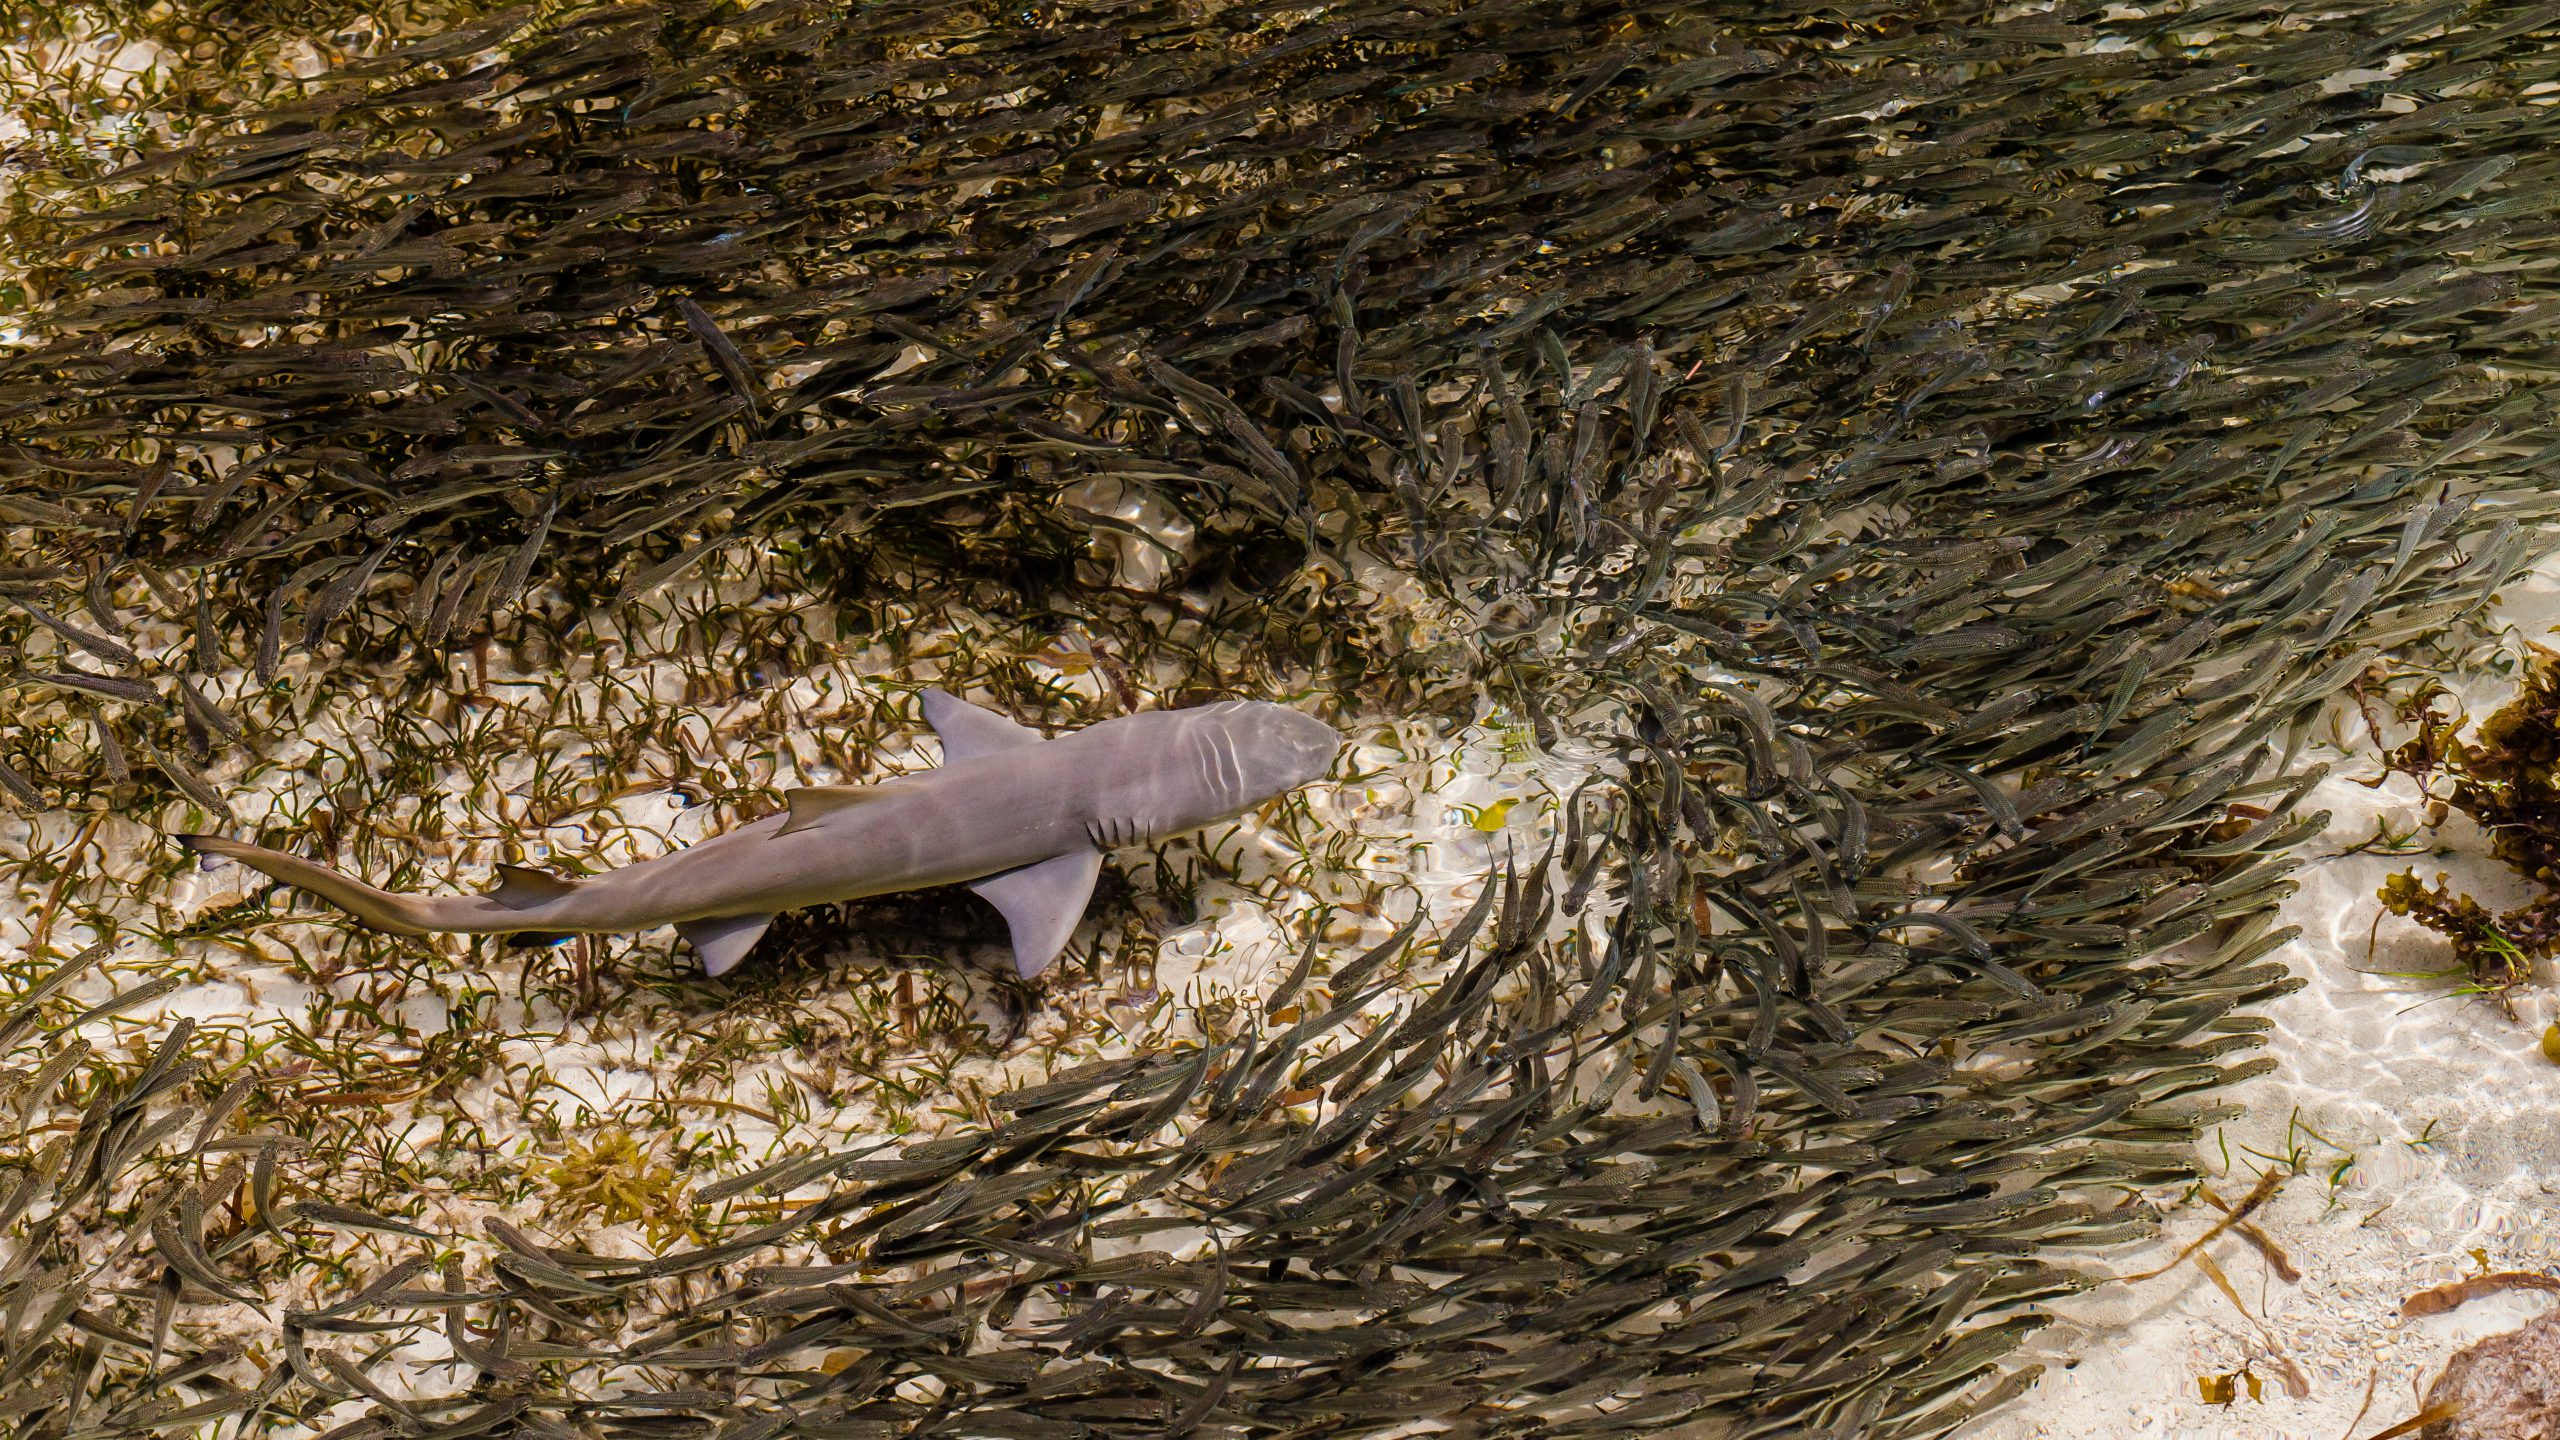
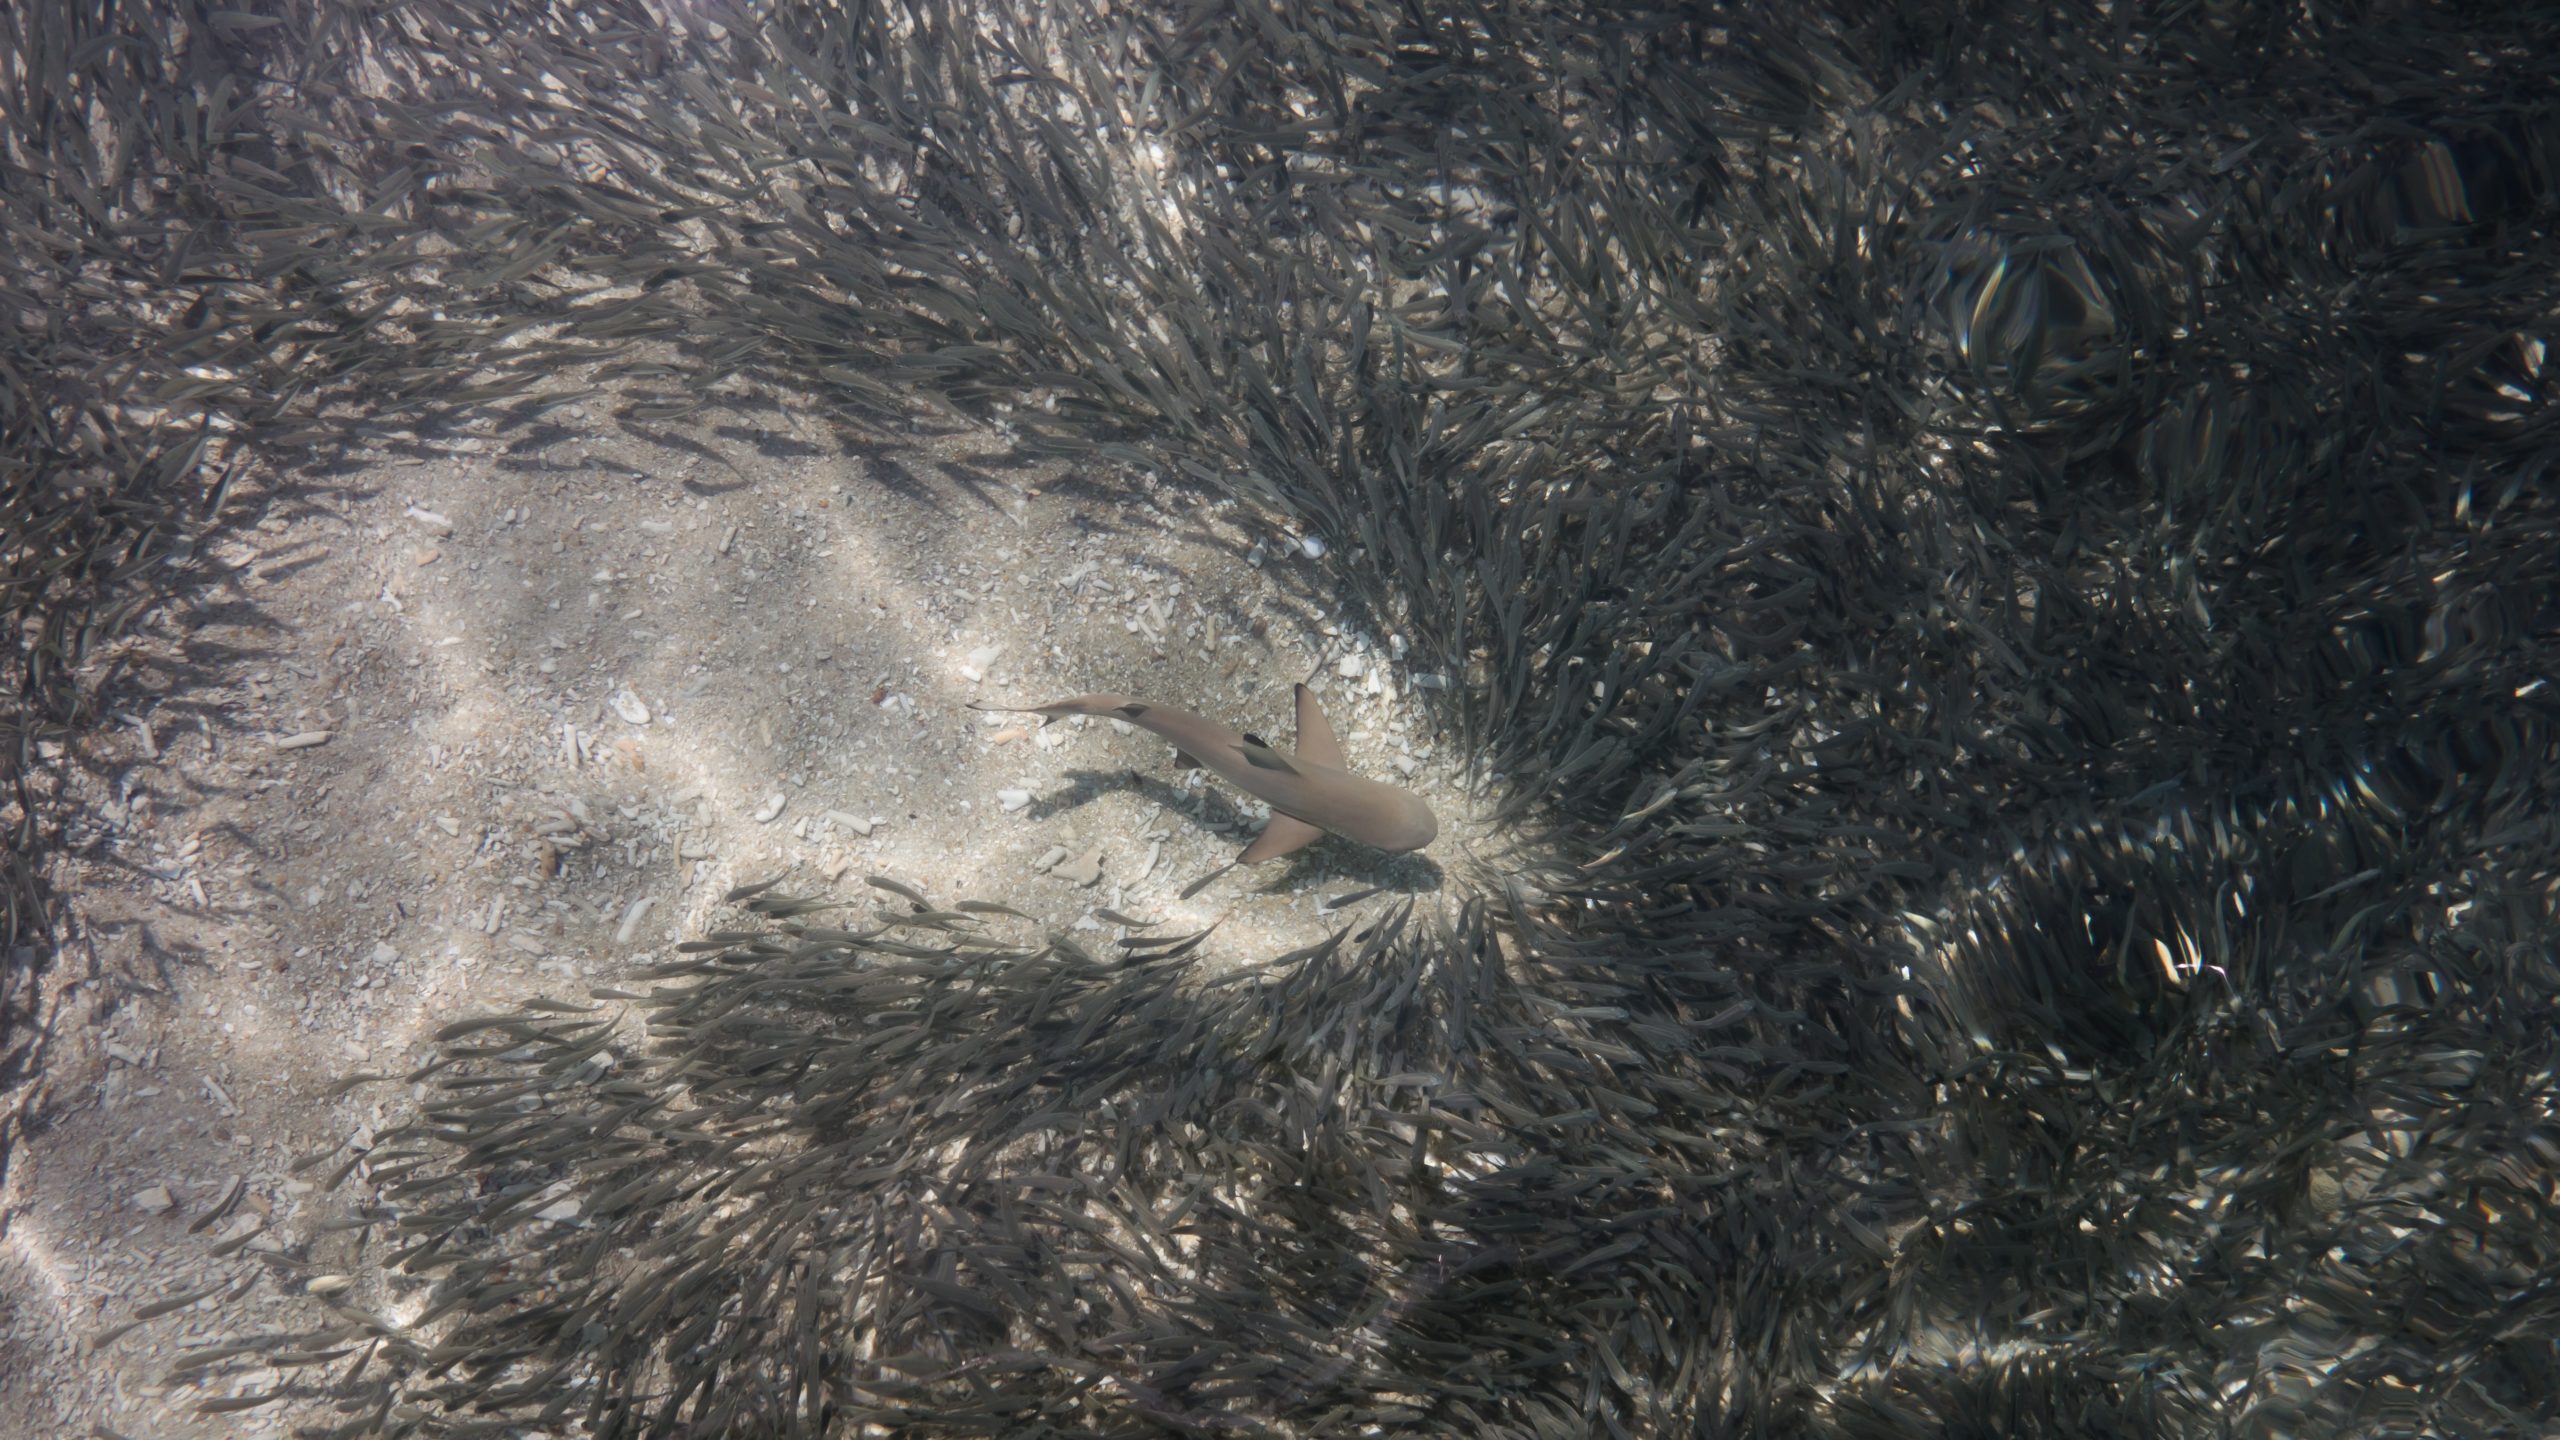
This energy transfer continues up the food chain, with only 10% of energy from the previous level being moved upwards each time. Energy is lost as heat or metabolic and digestive waste as the organism lives its life, but the volume of producers at the bottom level are usually large enough to supply the energy needs further up the pyramid. Because carnivores eat herbivores for energy, rather than eating the plants directly, they require close to 10x more plant mass at the base to support them. Fewer organisms can be supported as you move up the pyramid due to higher energy requirements and not enough prey to sustain a large population. This is why there are fewer numbers of sharks than their prey fish.
The Omnivore Problem
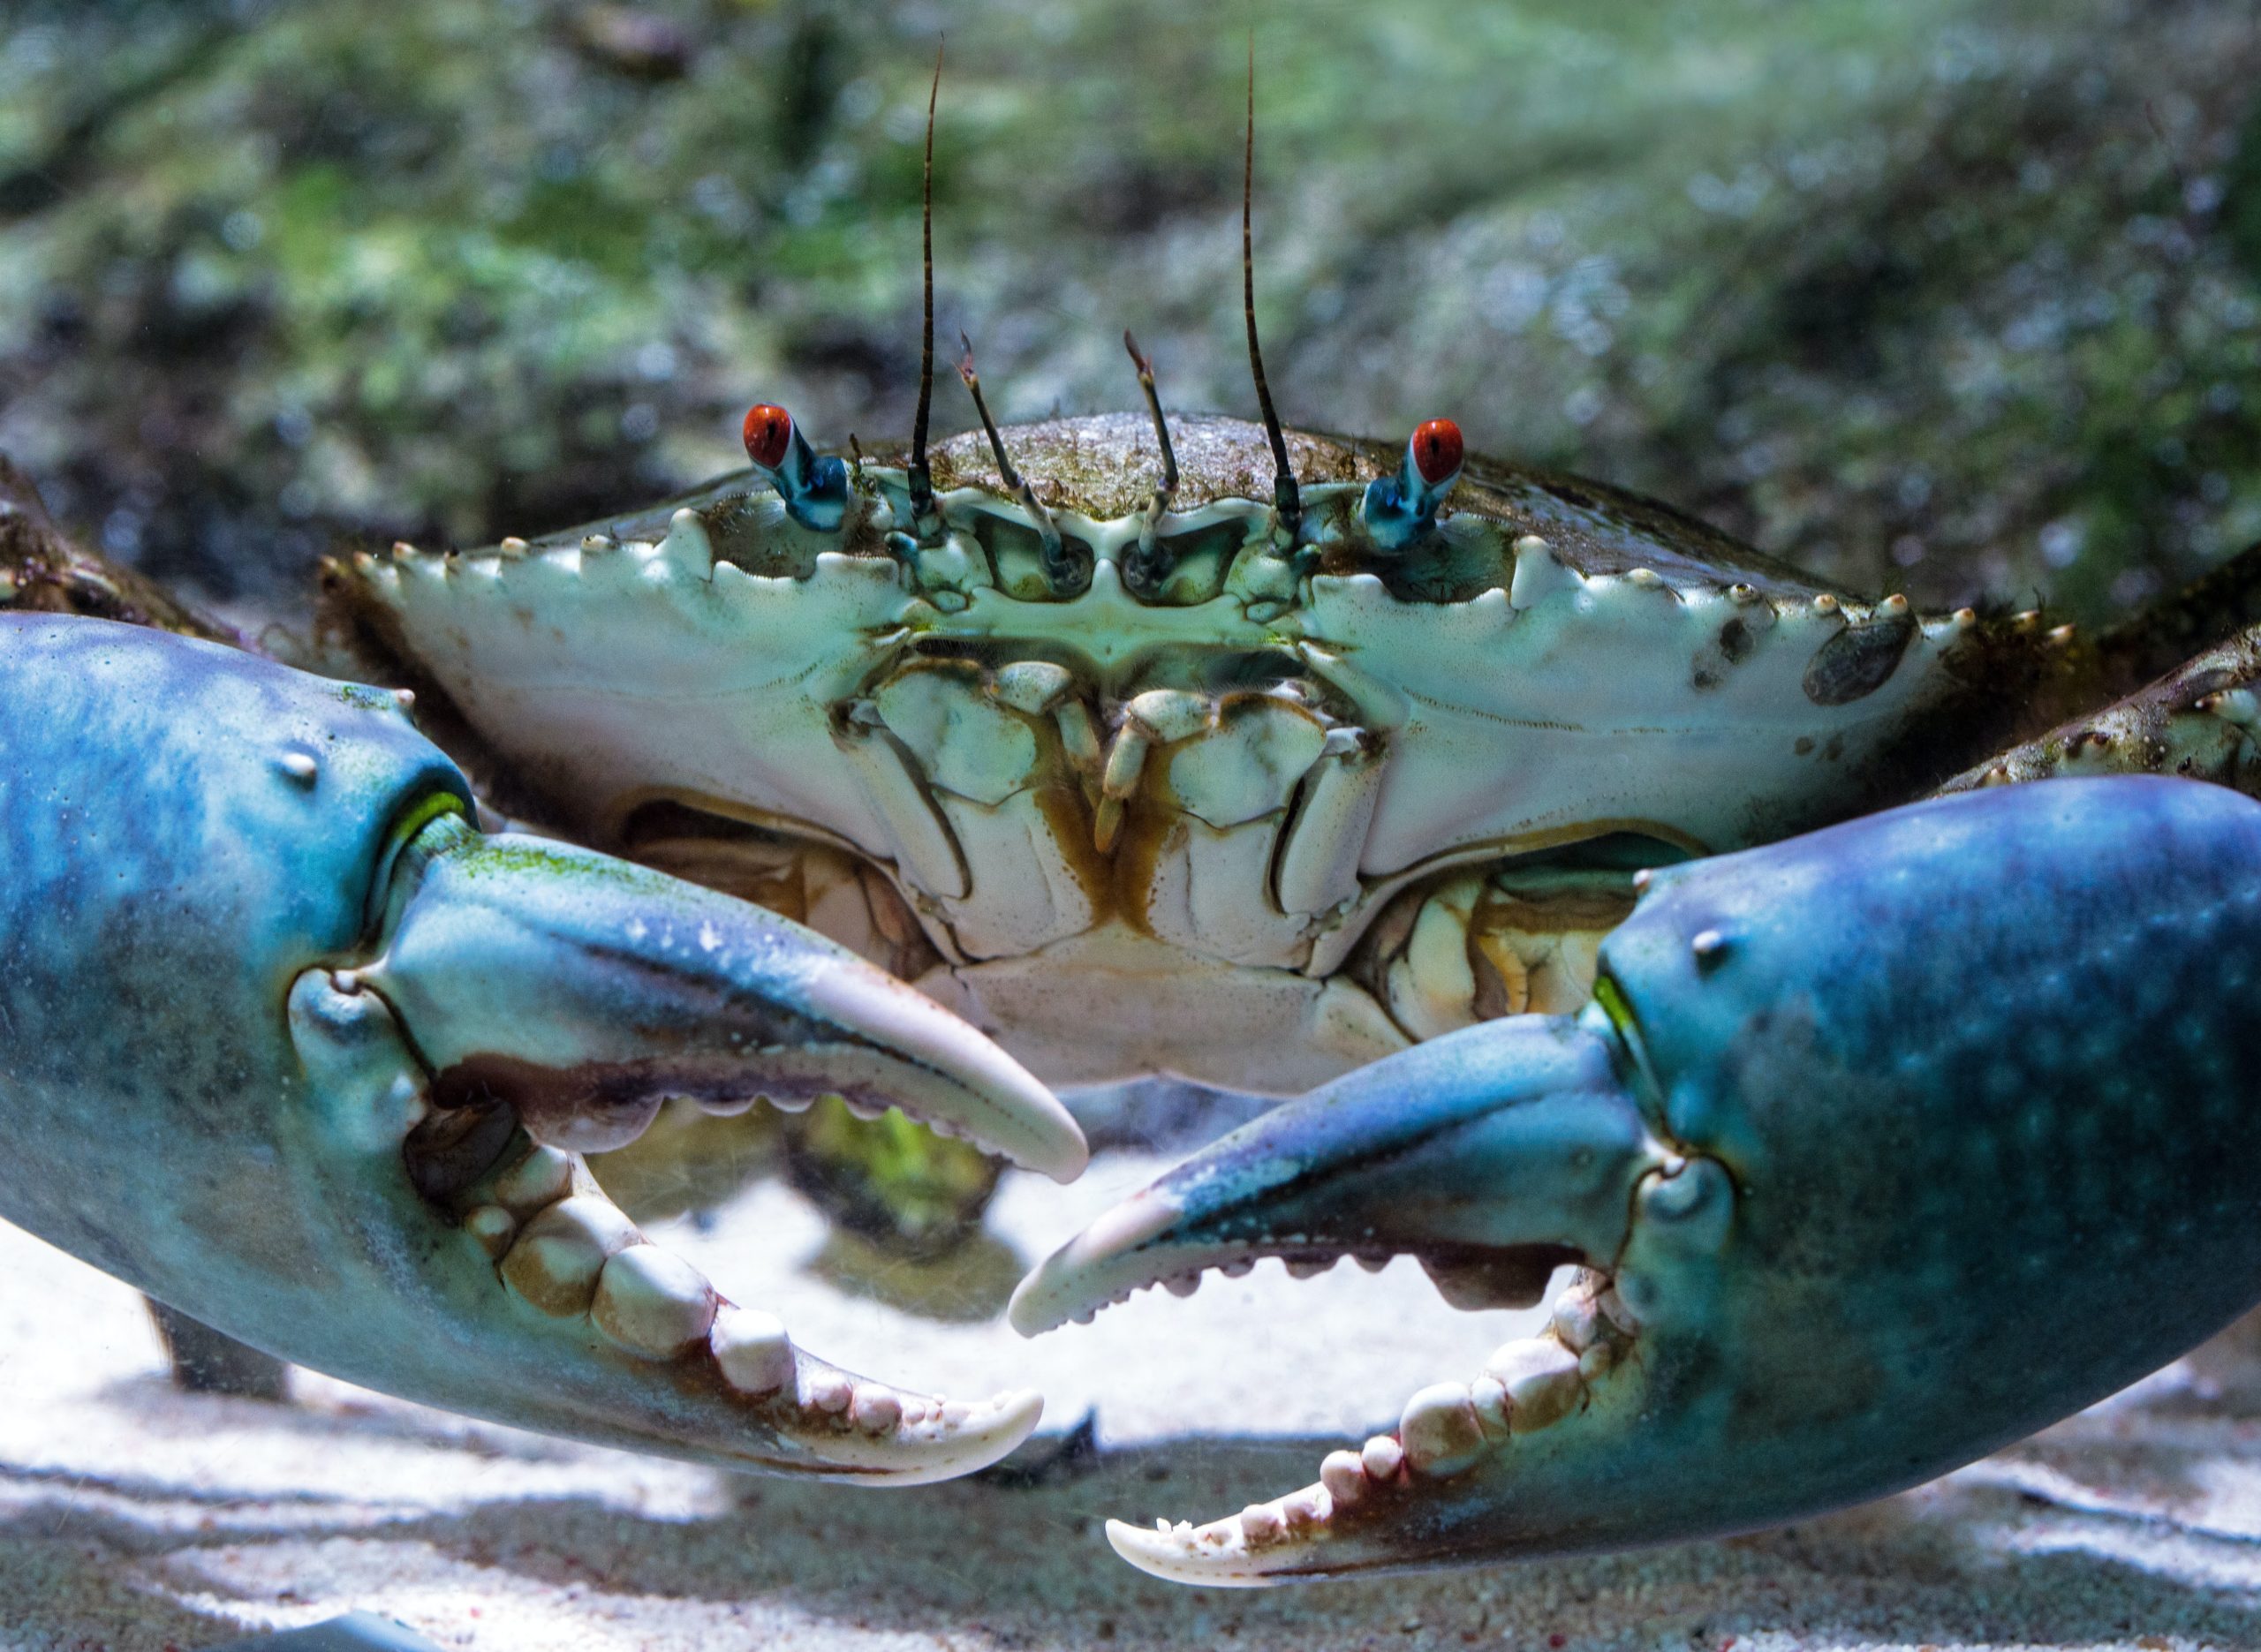
Since trophic webs can be extremely large and tangled, they often have many complications such as the presence of omnivores, decomposers, and scavengers. Omnivores are animals that consume both plants and other animals. Because they receive energy from different types of food sources, it is difficult to accurately track the energy flow within that chain. Some examples of omnivores include certain marine turtles, some lobsters, and snails. Because the amount of energy they receive is difficult to calculate, omnivores are hard to categorize into one specific trophic level.
Decomposers create similar issues since they break down organic matter such as dead animals and plants which are then recycled into the soils. The nutrients in these soils are then often taken up by the primary producers to help them grow. Technically they gain energy from the tissues of plants and animals, but they are not carnivores. They contribute nutrients useful at the base of the food chain, but they are not primary producers – thus we question where they should sit.
Lastly, scavengers are animals that often prey on other dead animals and plant materials. As with omnivores, it is difficult to track energy consumption and position them neatly into one specific trophic level. It is often said that above the herbivorous trophic level, most food webs are a tangled web of omnivores.
Marine Versus Freshwater Trophic Levels
When looking at trophic levels in different ecosystems or environments, such as marine versus freshwater, there are many similarities and differences. The overall flow of the trophic webs is nearly identical, with the primary producers being at the base followed by the herbivorous consumers and ending with carnivorous consumers.
Carnivores
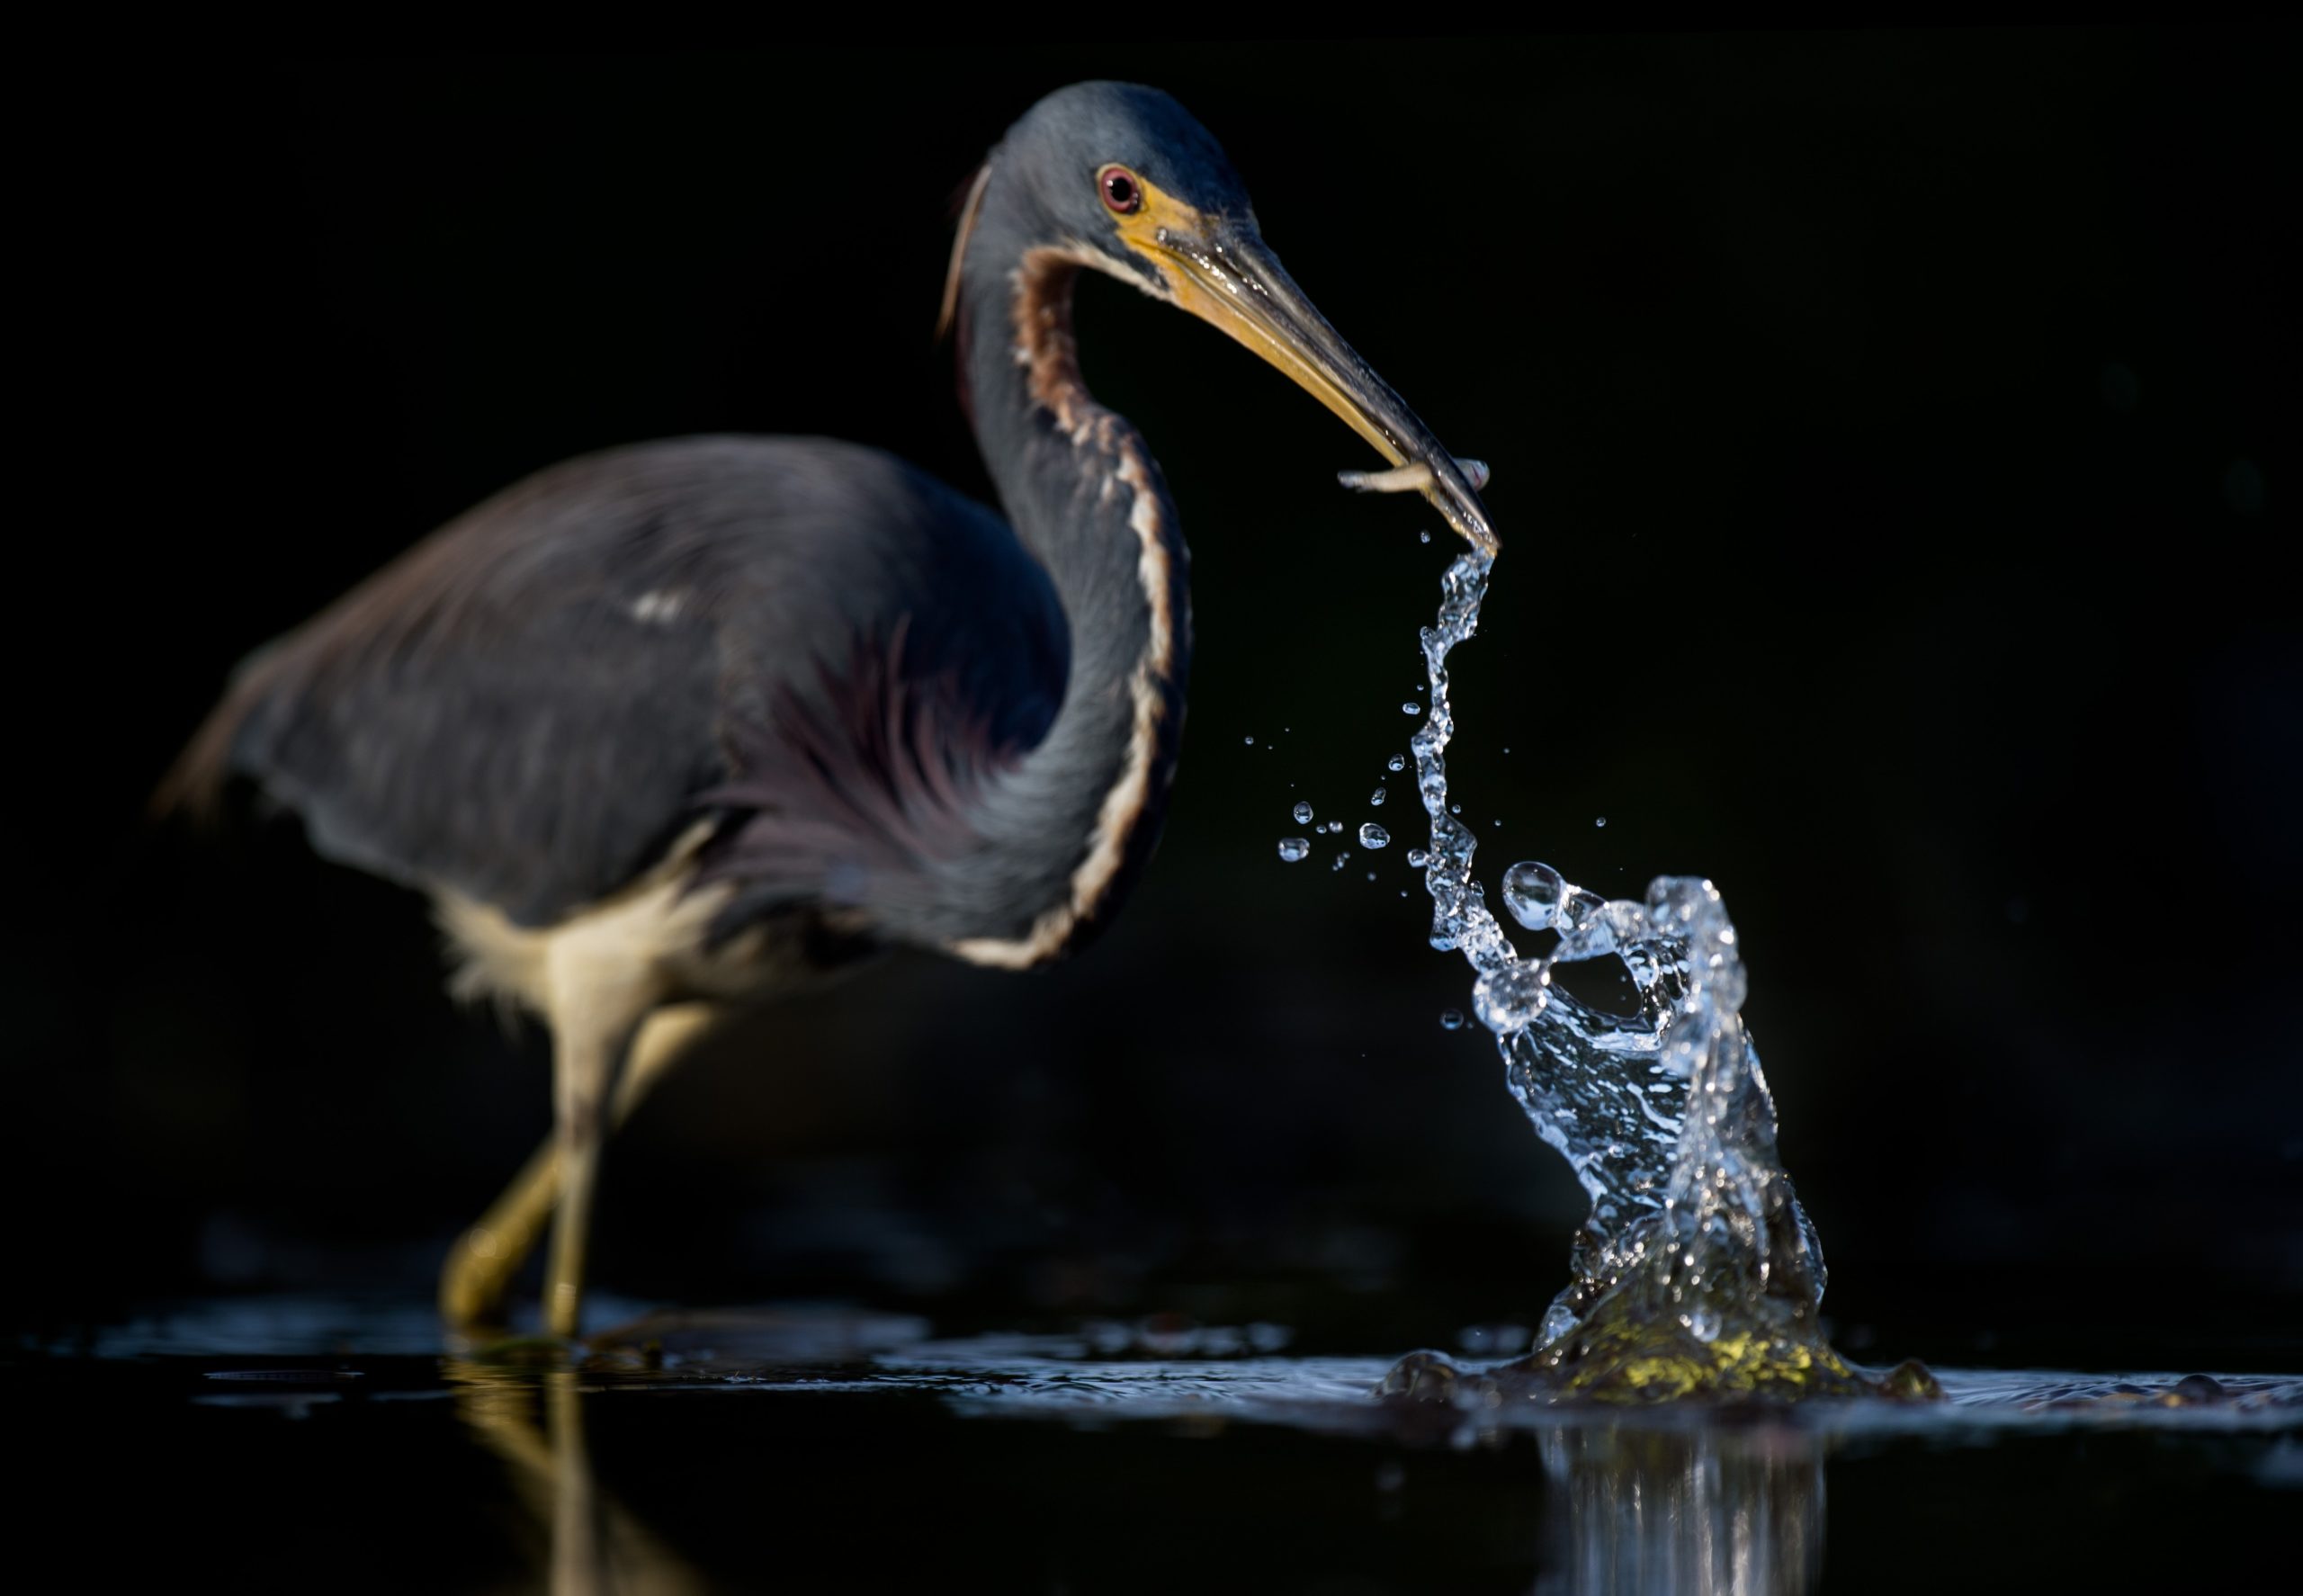
A major difference would be size and number of carnivores. The scale of oceans and marine environments allow top carnivores to grow larger in size and in number of top carnivores than freshwater environments, forming more complex trophic webs. For example, in marine environments have large carnivores such as orcas, great white sharks, dolphins, and polar bears, compared to freshwater environments whose top carnivores consist of heron, large fish such as lake trout, and alligators.
Larger carnivores may be due to the fact that there is much more space in ocean environments allowing for larger animals to fill ecological niches with less competitive overlap, and a difference in nutrient availability and greater access to various prey sources. Although marine environments can harbor larger and more carnivore types, both ecosystems have multiple levels of carivores involved in several trophic chains forming a complex web.
Nutrient Cycles
Nutrient cycles are also an important component of both ecosystems. For example, in freshwater, rivers and streams bring in nutrients to and from other areas such as ponds, lakes, and mountains. This creates a constant influx of nutrients being pumped into these environments. This can cause positive impacts such as aiding in the growth of different plants that rely on these nutrients, but also harmful effects such as harmful algal blooms which can cause a reduction in oxygen creating harsh unlivable environments for other animals. Other closed off freshwater ecosystems like ponds and lakes can have seasonal nutrient cycles as well, such as cold dense water sinking in the fall whilst warm water rises causing a natural mixing phenomenon. This causes certain elements such as carbon, phosphorous, and nitrogen to dominate based on the season. Nutrient cycles can cause changes in the structure of trophic webs when certain plants and animals are dependent on certain minerals based on the seasons.
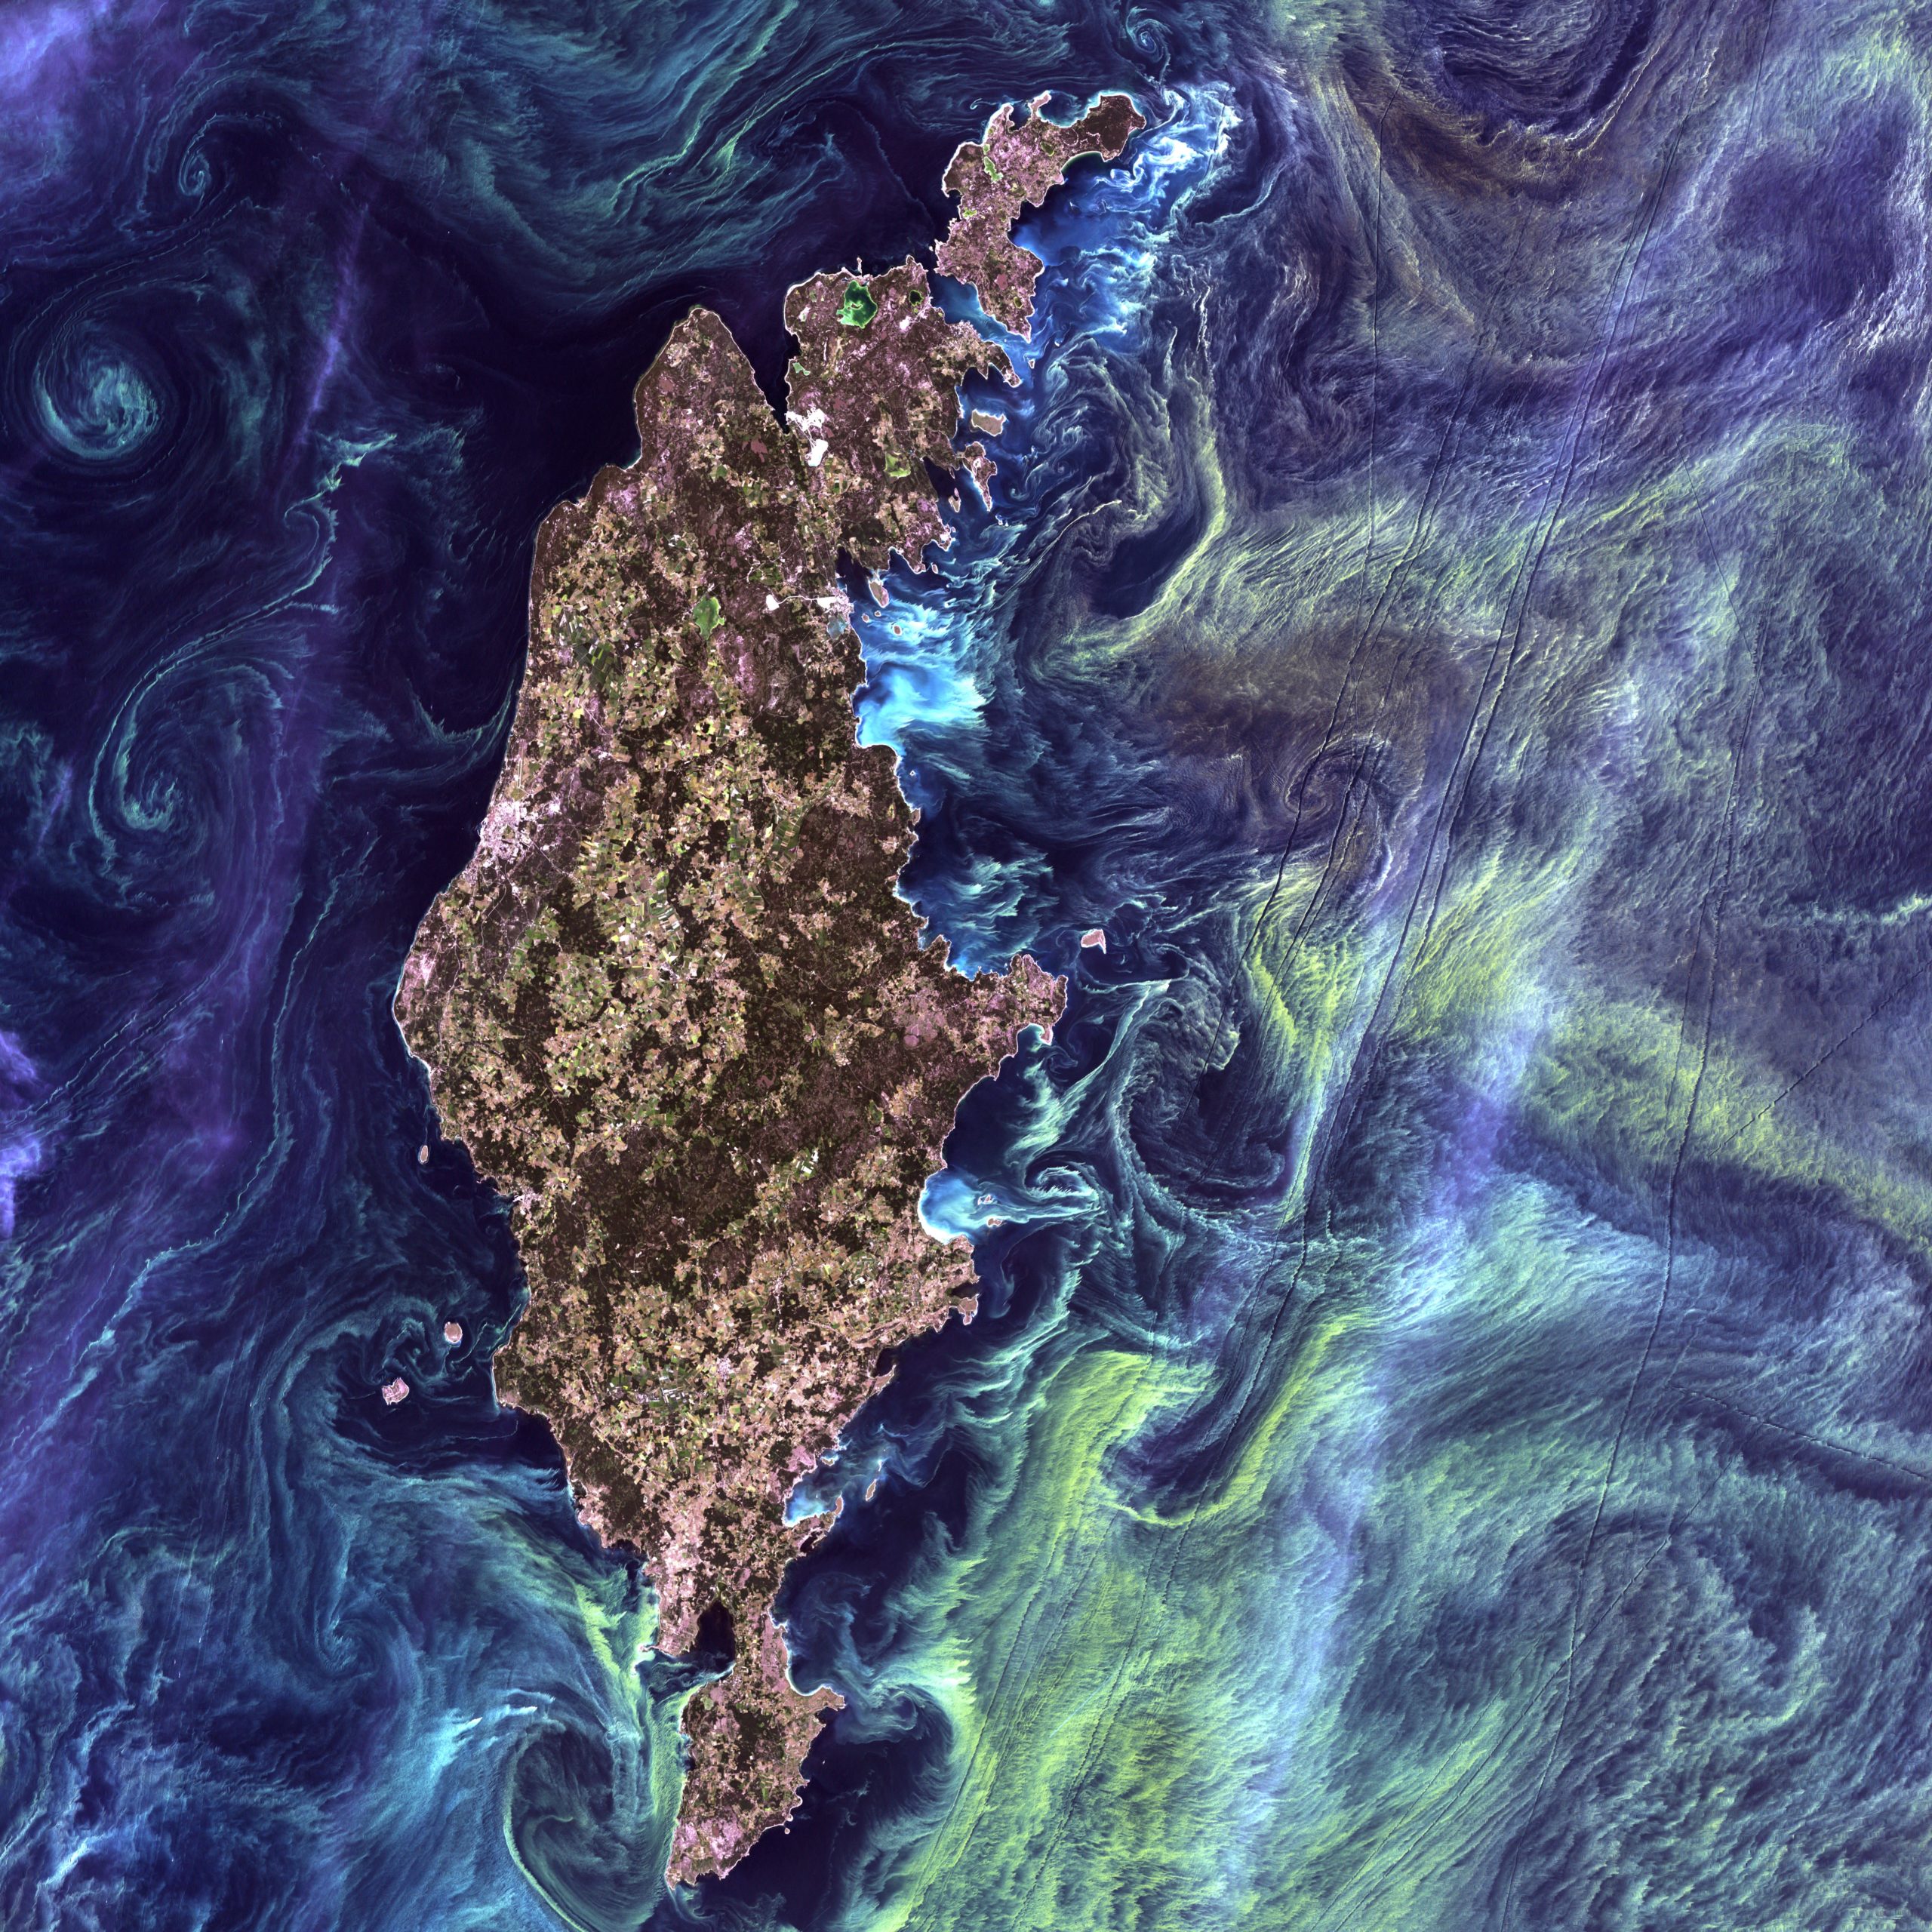
In marine ecosystems nutrient cycles vary depending on location, so nutrients found along coasts are different than those found in the deep sea. Nitrogen availability again is one of the major factors regulating primary production in many costal environments. There is larger scale mixing through boundary currents, costal upwelling, and deep mixing. During these events nutrients coming in through various avenues and can be chemically altered, deposited, and recycled. Nutrients in oceans also have positive and negative impacts, positively it can cause primary production to increase, increasing the primary producers in the area that nutrients are being deposited leading to blooms of algae, phytoplankton, zooplankton, and others, creating a cascading effect through the trophic chain. Negatively, it can also cause harmful algal blooms, and nutrient deficits in other areas. In both ecosystems, nutrient cycles differ but cause fairly similar effects throughout the trophic chains.
Final Thoughts & Coming Up Next
Although the concept can overly simplify the complexity of food webs, trophic levels and systems are helpful to illustrate how energy moves within an ecosystem. Since humans consume, in various ways, at all levels of aquatic trophic systems, the concept can help us better understand why certain organisms are more sustainable than others.
The next installment in this series Trophic Levels Part 2: Cascades and Controls will explain how these trophic systems are regulated through top-down and bottom-up controls.
Aquablog written by Ocean Wise Seafood volunteer, Rahana Ebrahim
Image Credits:
- Header: Thomas Lipke, Unsplash
- Photo 1: NOAA, Unsplash
- Photo 2: https://www.sciencelearn.org.nz/resources/367-toxins-and-food-webs
- Photo 3: Kris Mikael, Unsplash
- Photo 4: David Clode, Unsplash
- Photo 5: Thomas Lipke, Unsplash
- Photo 6: Ray Hennessy, Unsplash
- Photo 7: USGS, Unsplash
Posted August 6, 2021 by Ocean Wise